Manufacturing
Energy Intelligence
See exactly where energy costs hit your production lines — and where they can be cut.
Omni Vision meters every utility stream across your manufacturing facility — electricity, gas, water, steam, compressed air — plus any process sensor or PLC tag your lines run. Custom KPI dashboards map consumption directly to your production output. EPSA Energy's AI analytics identify waste, forecast demand, and surface savings opportunities automatically.
Omni Vision
At a Glance
Turnkey metering and AI analytics platform — EnerTherm precision hardware and PLC integration combined with EPSA Energy's cloud intelligence and real-time custom KPI dashboards.
Manufacturing
Applications
Select an application to see how Omni Vision transforms your manufacturing energy performance.
Omni Vision meters all six utility streams and maps consumption directly to your production lines, shifts, and batches. You see exactly what each product costs to manufacture in energy terms — enabling targeted cost reduction where it matters most, not guesswork based on aggregate bills.
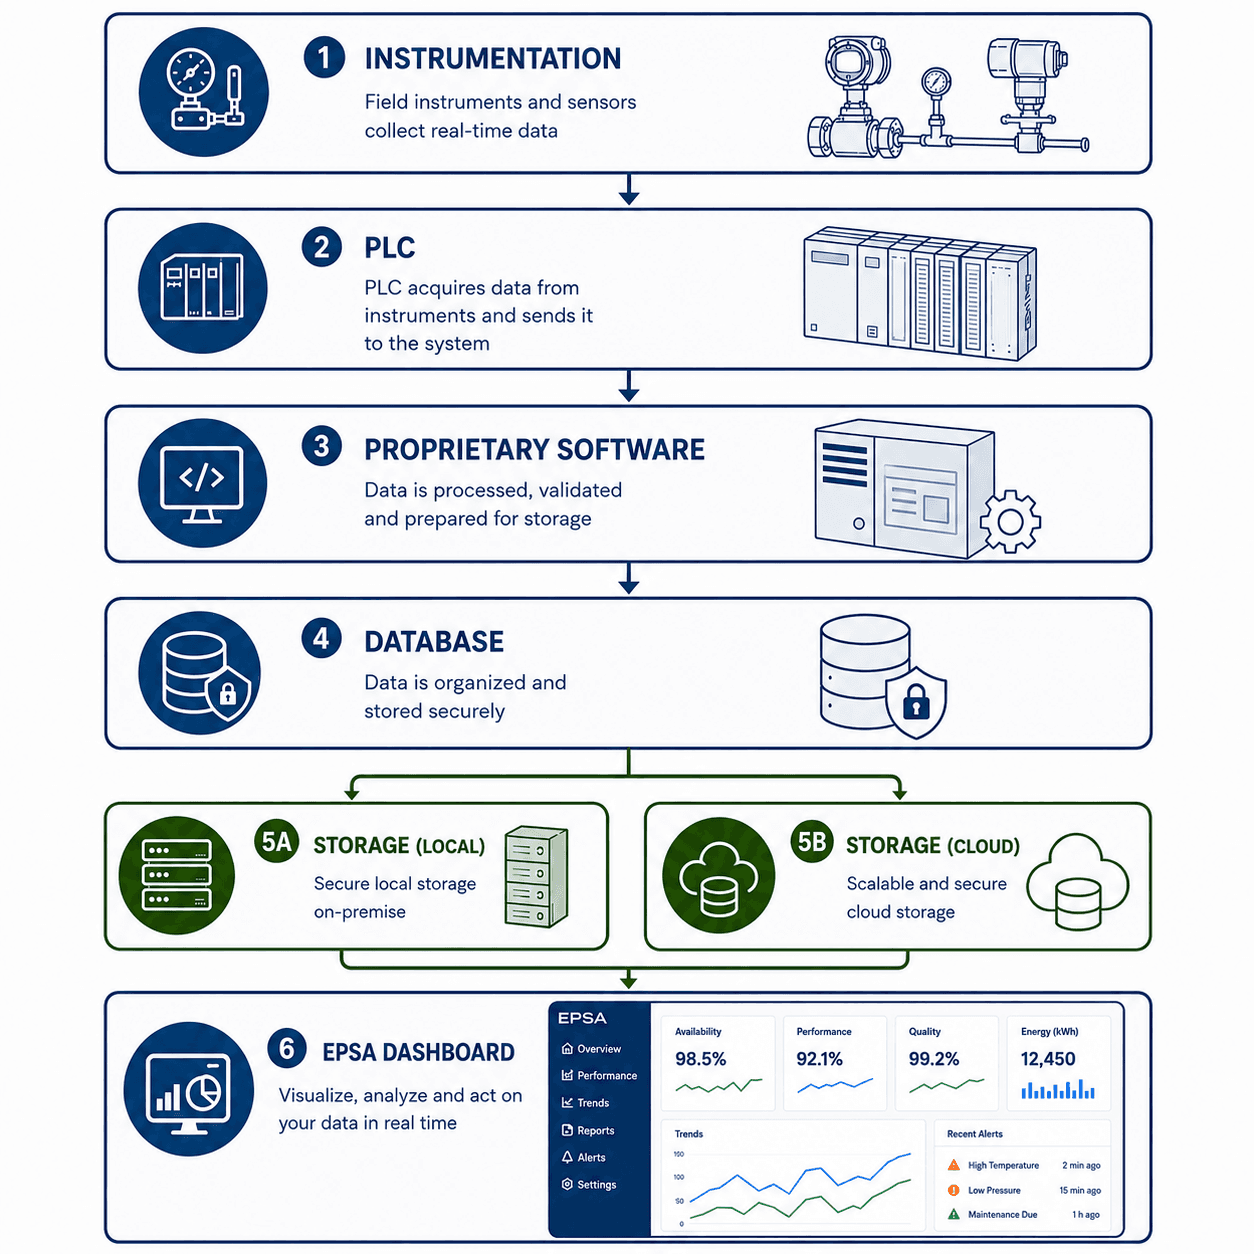
Any Data Source
Six utilities plus any sensor, signal, or PLC tag
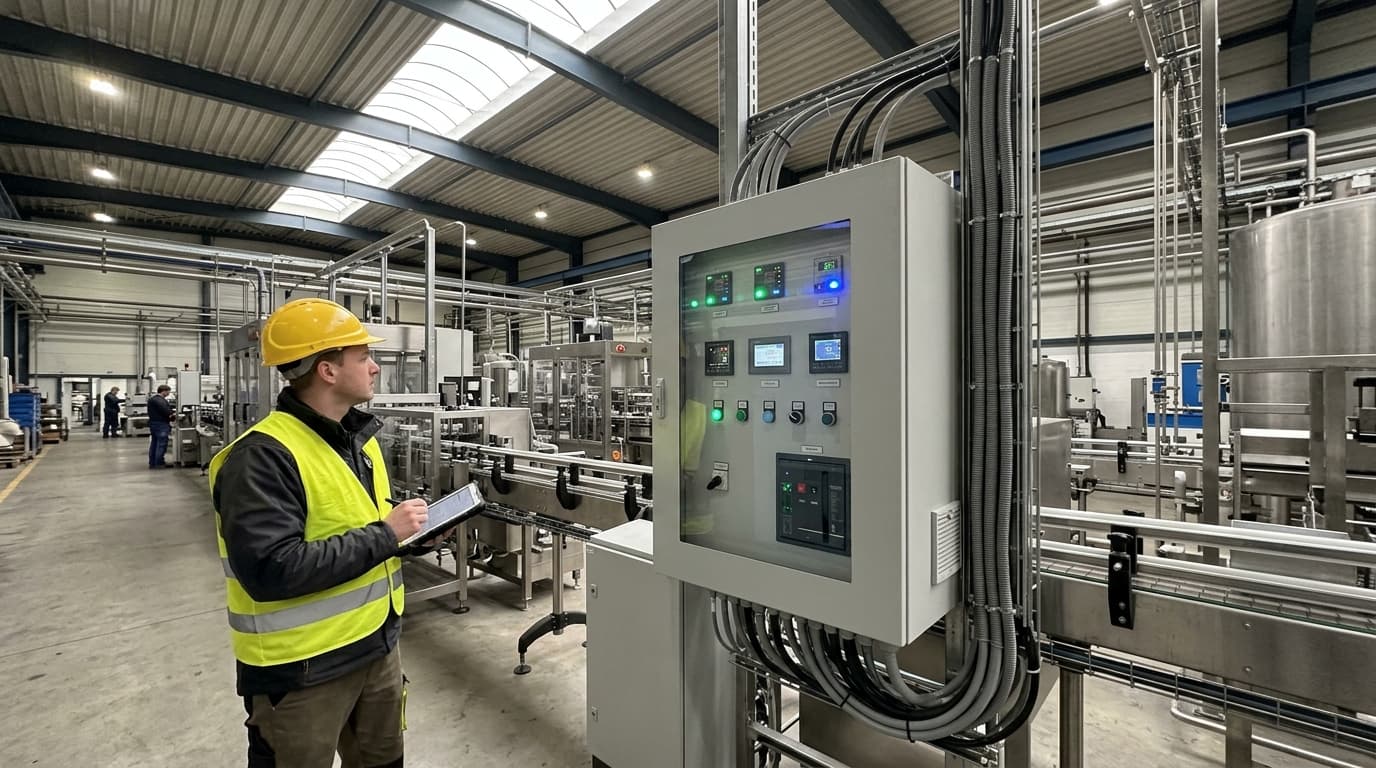
PLC Integration
Reads existing PLCs — Modbus, OPC-UA, BACnet
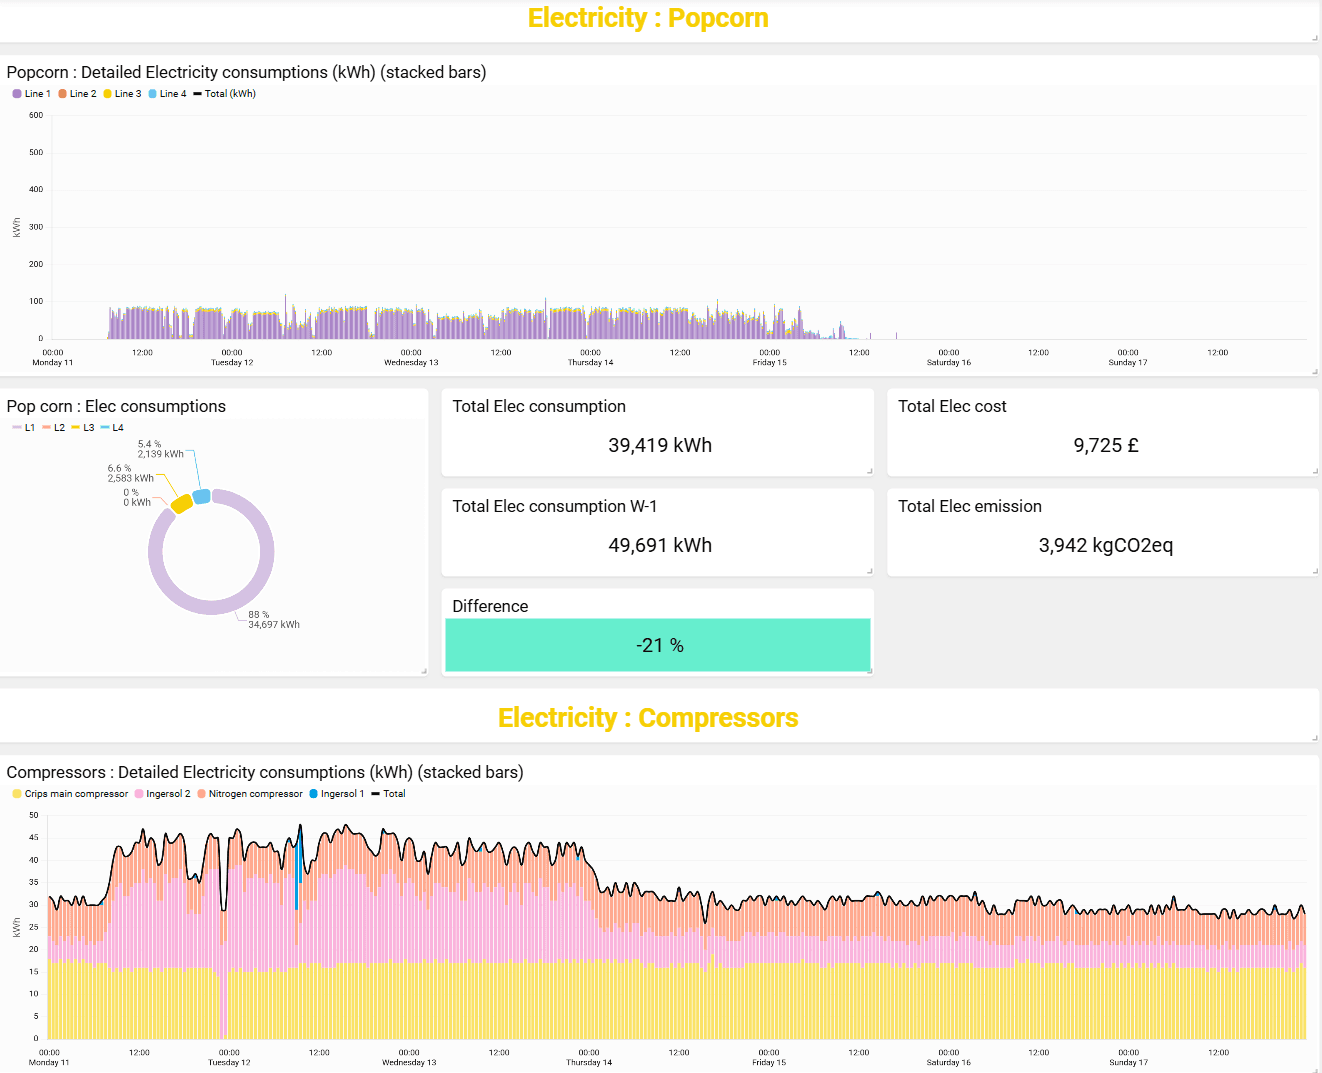
Real-Time Custom KPIs
Live dashboards built around your metrics, no templates
Turnkey Delivery
One contract from survey to live dashboards
Built for
Manufacturing
Key advantages of Omni Vision deployment on your factory floor.
Cost-Per-Unit Visibility
See the exact energy cost of every product you manufacture — by line, shift, or batch — so you know where margin is being lost.
AI-Driven Savings
Machine learning analyses consumption patterns around the clock, automatically identifying waste, forecasting demand, and surfacing savings you would never find manually.
Connect Anything
Electricity, gas, water, steam, compressed air, and oil — plus any process sensor or PLC tag — all metered, all mapped, all visible in a single platform. No blind spots.
Real-Time Custom KPIs
Energy per unit, cost per tonne, intensity per shift — live dashboards built around the metrics that matter to your operation, not generic templates.
CO2 Emissions Tracking
Scope I and Scope II carbon emissions calculated automatically from metered data — audit-ready reporting without manual spreadsheets or consultants.
Turnkey Deployment
Site survey, instrumentation, panel build, M&E installation, PLC integration, cloud connectivity, and commissioning — one contract, 8-16 weeks, fully operational.
Manufacturing
Omni Vision FAQ
Common questions about Omni Vision deployment in manufacturing environments.
Electricity, gas, water, steam, compressed air, and oil — every stream captured through precision instrumentation sized for your facility during the site survey. Beyond utilities, it connects to any process sensor, signal, or PLC tag your lines run. If it produces data, it can be captured and put on your dashboard.
Omni Vision combines metered utility data with production counts to calculate KPIs like energy per unit, cost per tonne, and intensity per shift — automatically, in real time, without manual data entry.
Typically 8-16 weeks from site survey to live dashboards. The turnkey process covers instrumentation sizing, panel build, M&E installation, PLC integration, cloud connectivity, and commissioning under a single contract.
Yes. Omni Vision reads existing PLCs via Modbus, OPC-UA, BACnet, and MQTT protocols — read-only, so there is zero interference with plant operations. No reprogramming or downtime required.
Scope I and Scope II emissions are calculated automatically from your metered gas and electricity consumption using current emission factors. The data is audit-ready and updates in real time.
Typical energy cost reductions of 15-25%, with payback under 12 months. Savings come from waste elimination, demand optimisation, and operational improvements identified by the AI analytics engine.
Smarter
Manufacturing
Deploy Omni Vision across your manufacturing facility for full utility visibility, production KPI mapping, and AI-powered energy savings.
- Full utility metering & cost mapping
- AI-powered savings identification
- CO2 Scope I + II tracking
- 8-16 week turnkey deployment